Analyzing periodic surface textures
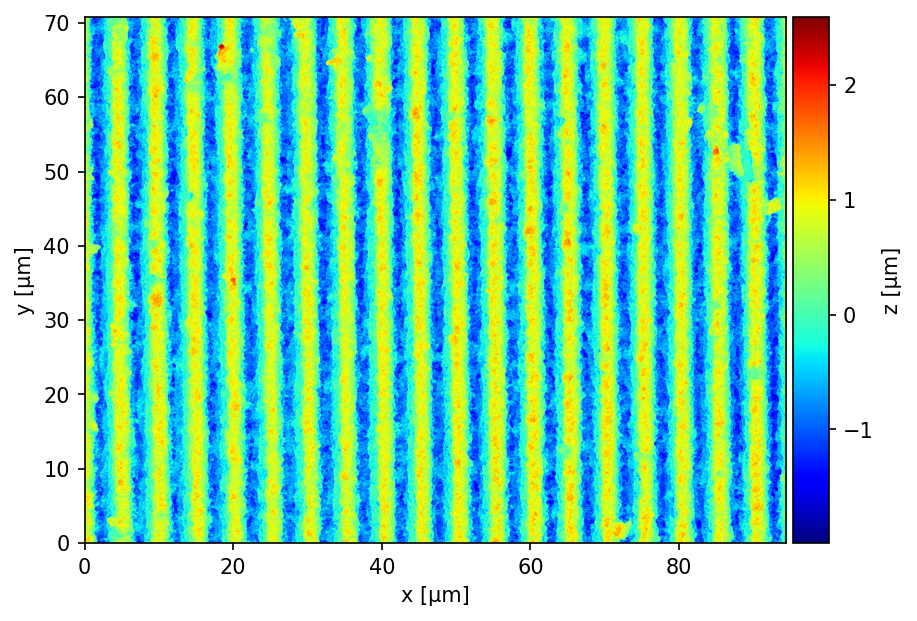
surfalize is built primarily for periodically microtextured surfaces. This example shows the parameters and visualizations tailored to that use case, using a laser-textured sample with a near-1D periodic structure.
[1]:
from surfalize import Surface
from surfalize.examples import list_examples

surface = list_examples('.vk4')[0].load().level()
surface
[1]:
Surface(94.40 x 70.79 µm²)
Spatial period and orientation
period returns the dominant spatial period, orientation the angle of the texture, and aspect_ratio the ratio of the two principal periods.
[2]:
print(f'Period:       {surface.period():.3f} µm')
print(f'Orientation:  {surface.orientation():.2f}°')
print(f'Aspect ratio: {surface.aspect_ratio():.3f}')
Period:       4.968 µm
Orientation:  0.63°
Aspect ratio: 0.352
Structure depth
depth estimates the mean peak-to-valley depth of the periodic structure (and its standard deviation) by sampling many profiles across the surface.
[3]:
depth_mean, depth_std = surface.depth()
print(f'Depth: {depth_mean:.3f} ± {depth_std:.3f} µm')
Depth: 1.747 ± 0.276 µm
Homogeneity
homogeneity returns a value between 0 and 1 quantifying how uniform the texture is across the field of view.
[4]:
surface.homogeneity()
[4]:
np.float64(0.9675)
Autocorrelation function
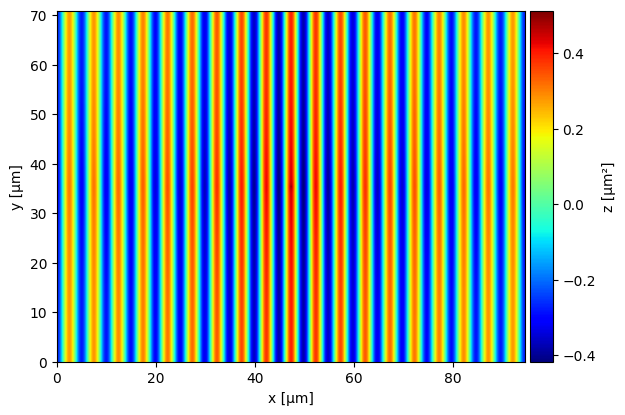
The areal autocorrelation function reveals the periodicity and directionality of the texture.
[5]:
surface.plot_autocorrelation();
Fourier transform
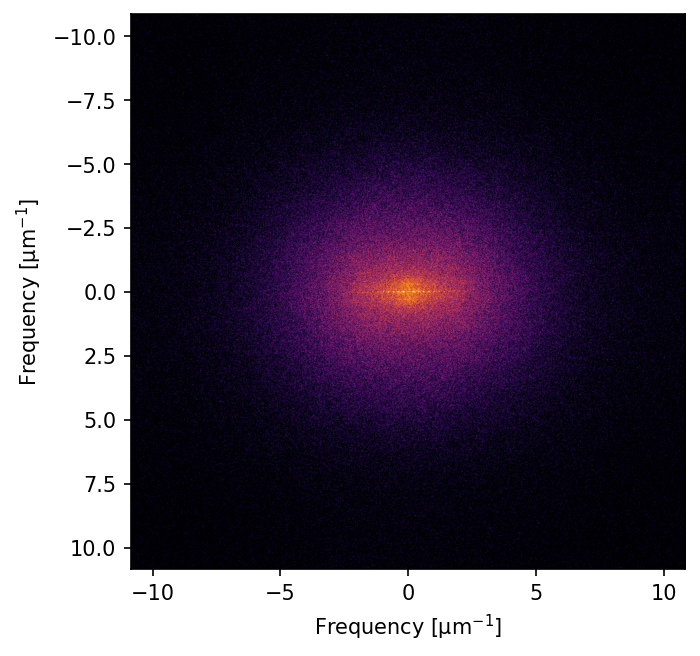
The 2D power spectrum shows the spatial frequencies that make up the texture.
[6]:
surface.plot_fourier_transform(hanning=True);
Angular power spectrum
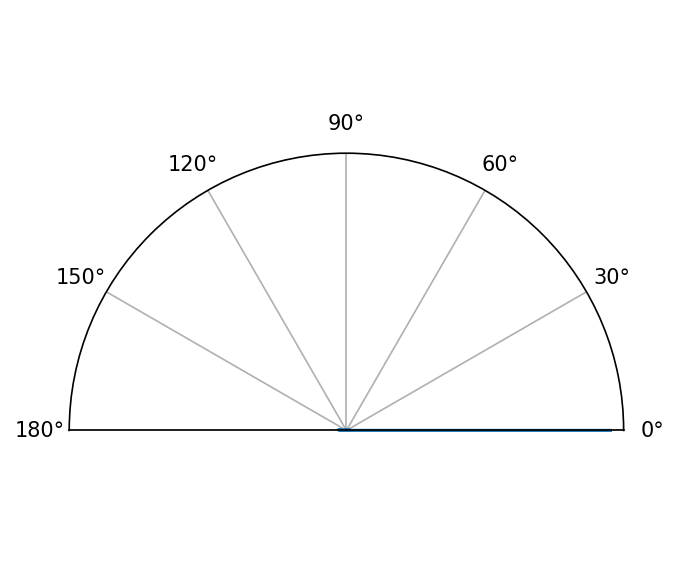
Integrating the power spectrum over radius as a function of angle highlights the dominant texture orientation.
[7]:
surface.plot_angular_power_spectrum();