Extracting and analyzing profiles
Besides areal (3D) parameters, surfalize can extract 2D profiles from a surface and compute profile roughness parameters from them.
[1]:
from surfalize import Surface
from surfalize.examples import list_examples

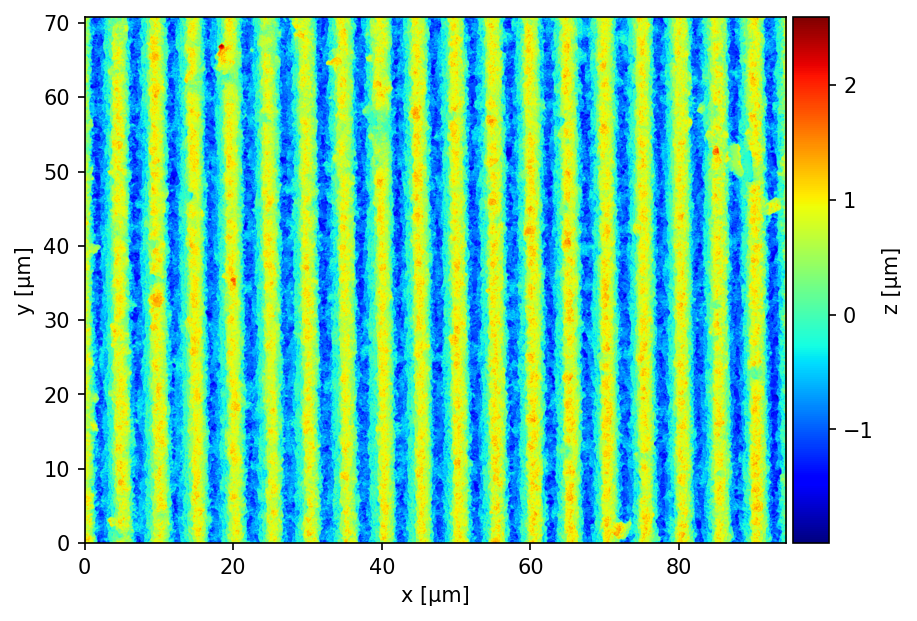
surface = list_examples('.vk4')[0].load().level()
surface
[1]:
Surface(94.40 x 70.79 µm²)
Horizontal, vertical and oblique profiles
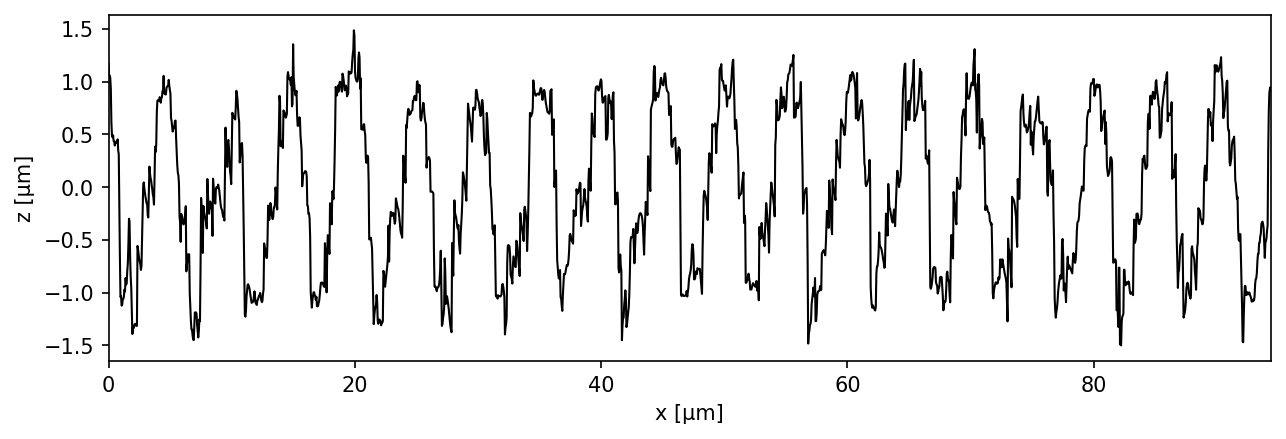
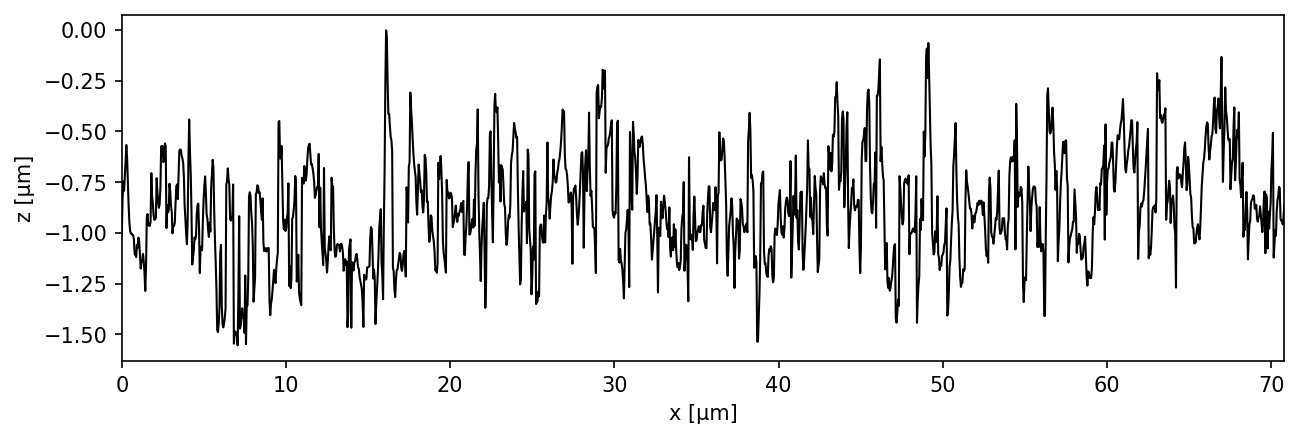
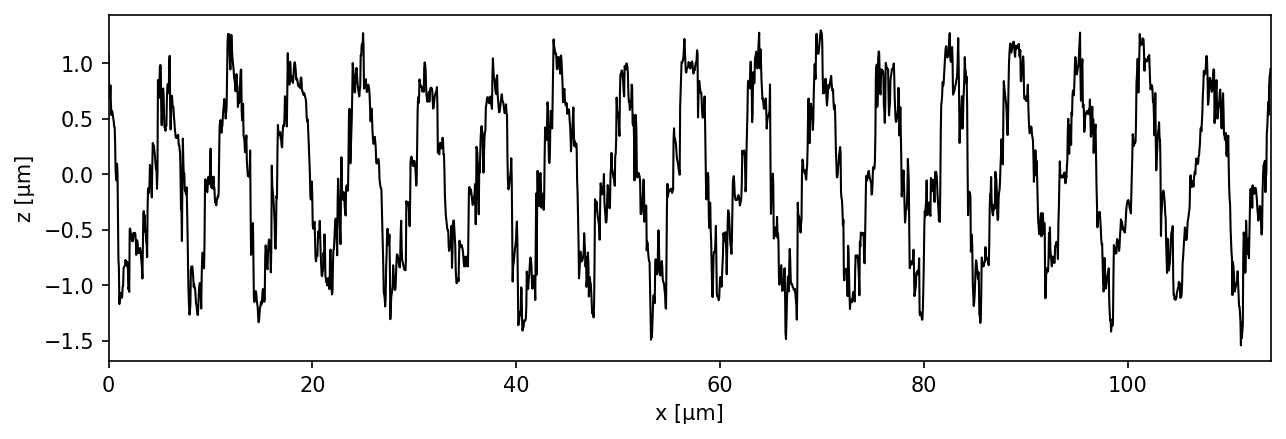
Horizontal and vertical profiles are taken at a coordinate given in µm. An oblique profile runs between two points. Each returns a Profile object, which renders as a line plot.
[2]:
profile = surface.get_horizontal_profile(35)  # y = 35 µm
profile
[2]:
Profile(94.40 µm)
[3]:
surface.get_vertical_profile(47) # x = 47 µm
[3]:
Profile(70.79 µm)
[4]:
surface.get_oblique_profile(0, 0, 90, 70)
[4]:
Profile(114.03 µm)
Profile roughness parameters
Profile exposes the standard profile parameters (Ra, Rq, Rz, Rsk, Rku) as well as the dominant spatial period.
[5]:
print(f'Ra     = {profile.Ra():.3f} µm')
print(f'Rq     = {profile.Rq():.3f} µm')
print(f'Rz     = {profile.Rz():.3f} µm')
print(f'Period = {profile.period():.3f} µm')
Ra     = 0.653 µm
Rq     = 0.742 µm
Rz     = 2.782 µm
Period = 4.971 µm
Plotting a profile
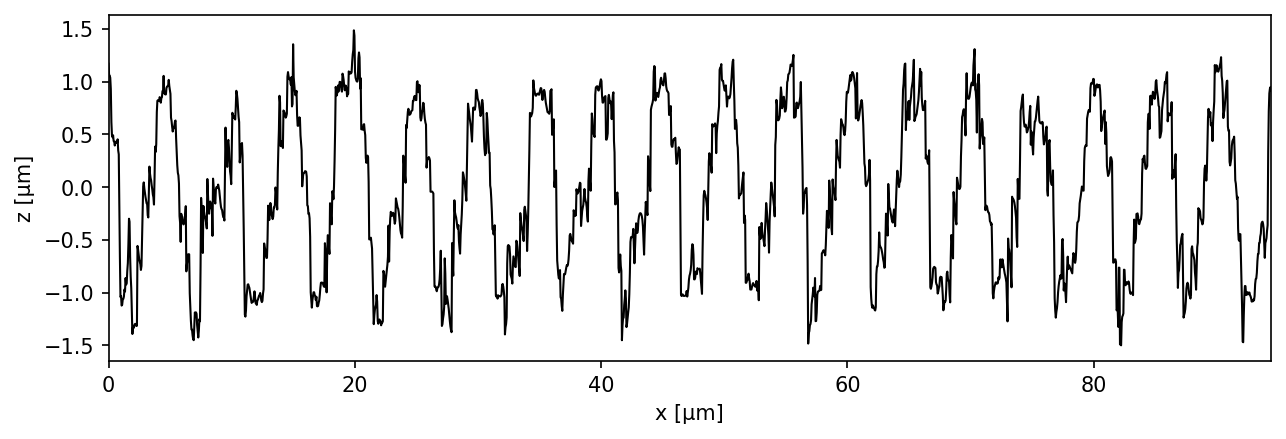
plot_2d draws the extracted profile on a matplotlib axis.
[6]:
profile.plot_2d();