[1]:
from surfalize import Surface
[4]:
import os
os.chdir(r'C:\Users\SchellFrederic\Documents\surfalize\tests\test_files')
Loading the file
[5]:
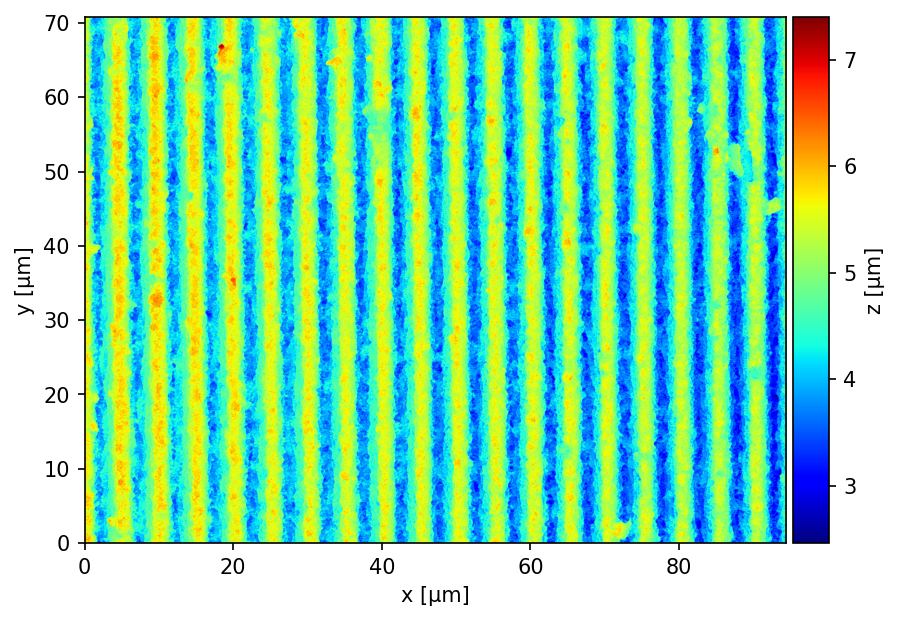
surface = Surface.load('test_1.vk4')
surface
[5]:
Surface(94.40 x 70.79 µm²)
Post-processing
[7]:
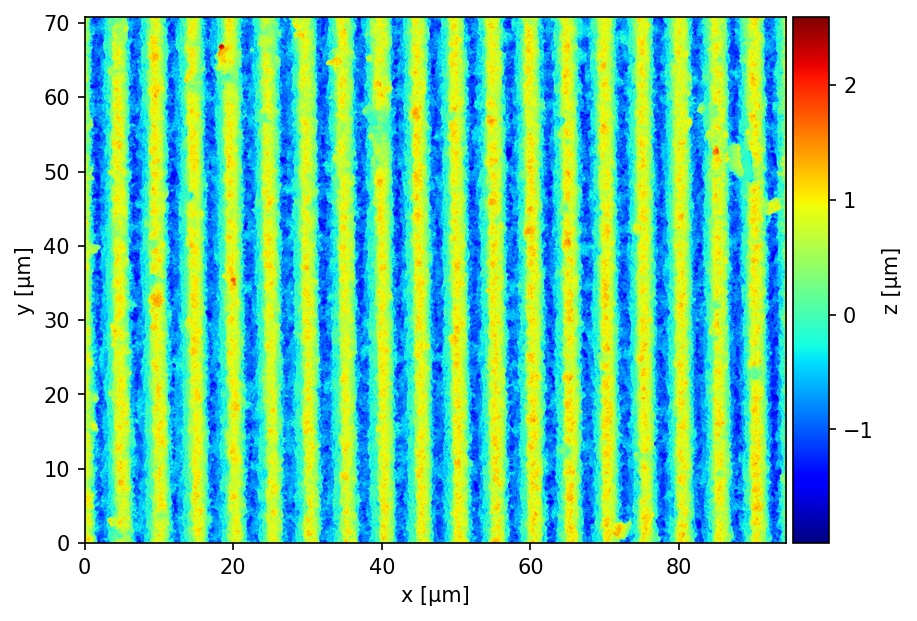
surface = surface.level()
surface
[7]:
Surface(94.40 x 70.79 µm²)
[8]:
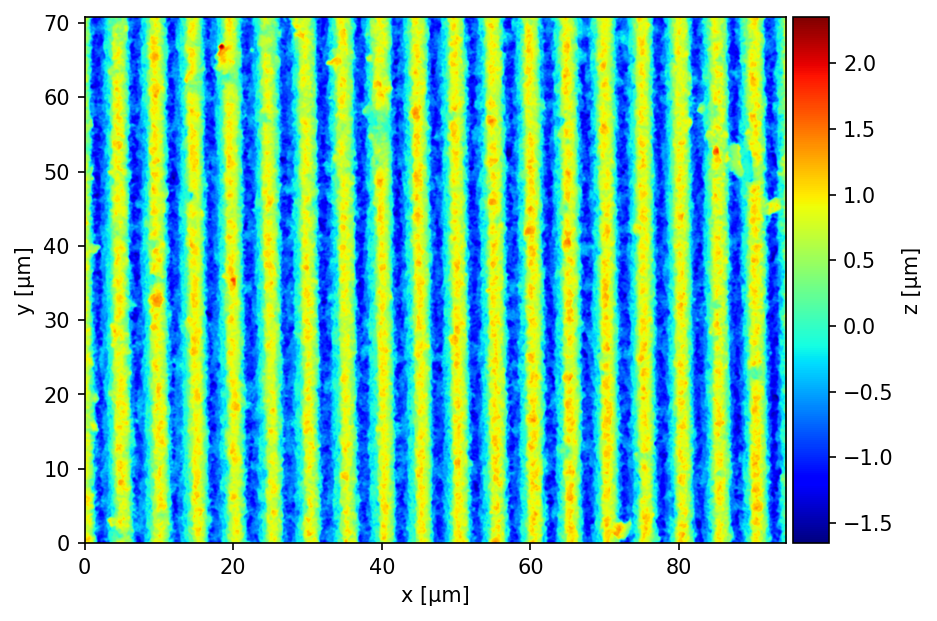
surface = surface.filter('lowpass', 0.5)
surface
[8]:
Surface(94.40 x 70.79 µm²)
Roughness parameters
[37]:
sa = surface.Sa()
sq = surface.Sq()
sdr = surface.Sdr()
print(f'Sa = {sa:.2f} µm')
print(f'Sq = {sq:.2f} µm')
print(f'Sdr = {sdr:.2f} %')
Sa = 0.60 µm
Sq = 0.69 µm
Sdr = 57.66 %
Periodic parameters
[34]:
p = surface.period()
depth_mean, depth_std = surface.depth()
h = surface.homogeneity()
ar = surface.aspect_ratio()
o = surface.orientation()
print(f'Period = {p:.2f} µm')
print(f'Homogeneity = {h}')
print(f'Aspect ratio = {ar:.2f}')
print(f'Depth = {depth_mean:.2f} ± {depth_std:.2f} µm')
print(f'Orientation = {o:.2f} °')
Period = 4.97 µm
Homogeneity = 0.9625
Aspect ratio = 0.35
Depth = 1.74 ± 0.25 µm
Orientation = 0.59 °
Plotting
[13]:
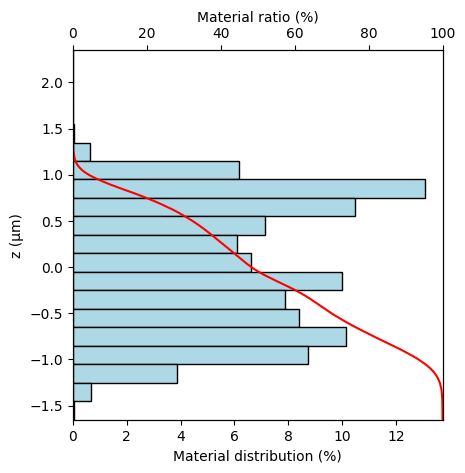
surface.plot_abbott_curve();
[19]:
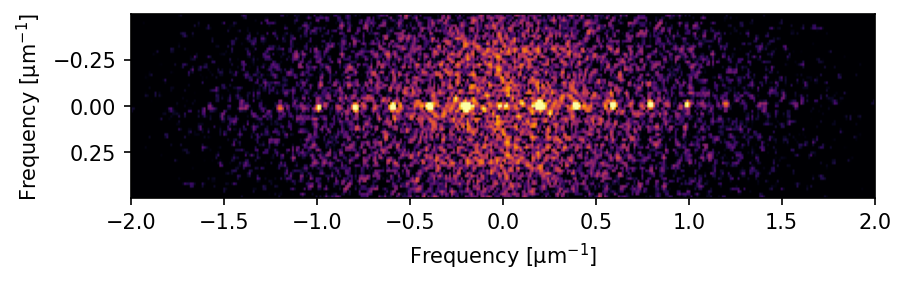
surface.plot_fourier_transform(hanning=True, fxmax=2, fymax=0.5);